RBMTX-Lite Realtime Graphs
The Realtime Graphs page of RBMTX-Lite router is used to view the CPU load, inbound and outbound traffic and network connactions graphs in real time.
Load
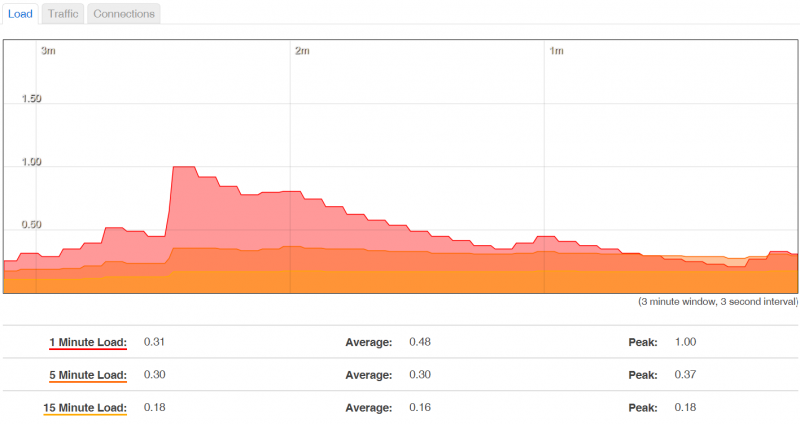
The Load section shows a graph of avarage CPU load from last 3 minutes in 3 seconds intervals. The charts come in three colors: red (1 minute), orange (5 minutes) and yellow (15 minutes) average load.
Traffic
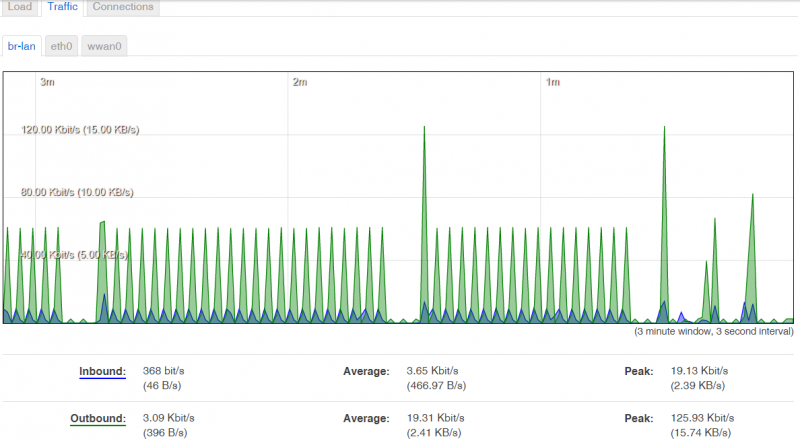
The Traffic section shows a graph of average inbound and outbound traffic from last 3 minutes in 3 seconds intervals. The charts come in two colors: blue (inbound traffic) and green (outbound traffic). You can switch between br-lan, eth0 and wwan0 interfaces where average and peak traffic values are shown.
Connections
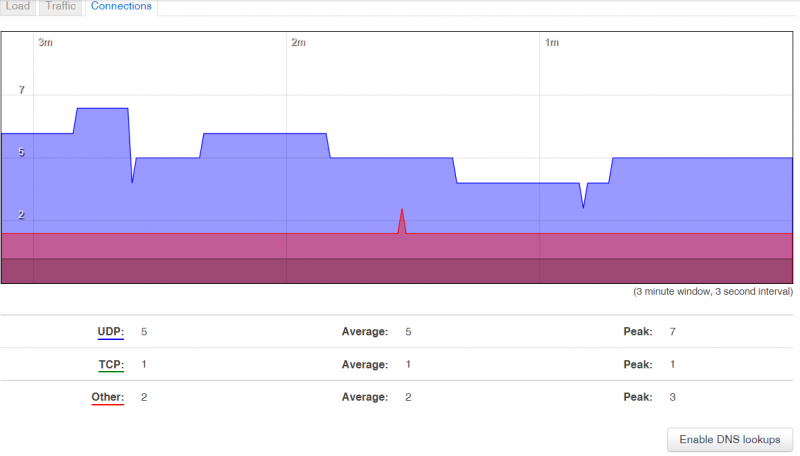
The Connections section shows a statistics about the active connections from last 3 minutes in 3 seconds intervals. The charts come in three colors: blue (corresponds to UDP connection), green (TCP) and red (Other). Use the button below the graph to enable DNS lookups. The corresponding connections statistics are also displayed on the table.
| Name | Description |
|---|---|
| Network | Network type: IPv6 or IPV4 |
| Protocol | Protocol type: TCP, UDP or ICMP |
| Source | Connection source IP address |
| Destination | Destination IP address |
| Transfer | Amount of transfer and number of packets |


